
Page 52 - ATZ11 November 2019 Professional
P. 52
DEVELOPMENT BODY
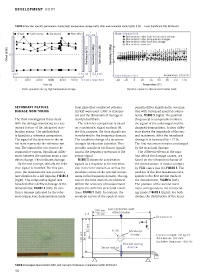
FIGURE 3 Function-specific parameters: during high-temperature storage (left), after environmental loads (right) (LSB = Least Significant Bit) (© Bosch)
SECONDARY FEATURE from glass fiber reinforced polymer ponents differ signi ficantly, see max-
DAMAGE MONITORING (GFRP) were used. GFRP is transpar- ima with increased spectral compo-
ent and the dimension of damage is nents, FIGURE 5 (right). The position
The third investigation focus deals clearly identifiable. (frequency) is comparable between
with the damage monitoring as a sec- The reference comparison is based the signal of the undamaged and the
ondary feature of the integrated acce- on a systematic signal analysis [6]. damaged demonstra tor. A clear differ-
leration sensor. The methodology For this purpose, the time signals are ence shows the magnitude of the sec-
is based on a reference comparison. transformed to the frequency domain. ond maximum. After the introduced
The signal of the structure in the ini- The condition change of a structure damage it is increased by +17 %.
tial state represents the reference sys- changes its vibration behavior. This The first maximum remains unchanged
tem. The signal after an event is the possibly manifests itself more signifi- by the structural damage.
comparative system. Significant differ- cant in the frequency spectrum of the The different effects at the max-
ences between the systems mean a con- sensor signal. ima which the damage causes, are
dition change. This indicates damage. FIGURE 5 shows the acceleration based on the vibration behavior of
By the test concept, initially the refer- signals as a response to the test vibra- the demonstrator. A modal analysis
ence signal is recorded. For this pur- tion in the time domain as well as the by FEM states this [6], FIGURE 6. The
pose, the demonstrator was put into a envelope curves of the spectral compo- position of the first maximum corre-
test vibration by a fall impulse, FIGURE 4 nents in the frequency domain. The sig- sponds to the first torsion mode of
(right). The comparative signal was nals in the time domain are identical the demonstrator, FIGURE 6 (left).
recorded after a defined damage of the within the accuracy of measurement The position of the second maxi-
demonstrator, FIGURE 4 (left). To con- despite the different structural condi- mum corresponds to the first bend-
firm a damage indicated by the refer- tions, FIGURE 5 (left). In contrast, the ing mode, FIGURE 6 (right). For both
ence comparison, demonstrators made envelope curves of the spectral com- modes, the distribution of the maxi-
FIGURE 4 Damaged demonstrator (left), test concept of reference comparison (right) (© Bosch)
46